The Photodo web site has a wealth of measured data, and some informative articles. In one of the articles, they compare resolution between 35mm, 6x6 medium format, and 9x12cm large format negatives, using two Kodak films, Tri-X and TMax 100. I have taken an excerpt from one of their images and run Fourier analysis to try to determine what spatial frequencies, are actually reproduced and at what contrast.
The Photodo site states that “With the images 120 mm wide on the computer screen, the 35 mm negative is enlarged about 75 times.” Using this figure, we compute that the 390-pixel width of the image would cover 1.6mm on the 35mm negative, giving a sampling density of 243.75 samples/mm.
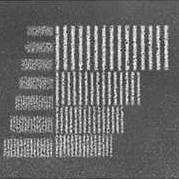
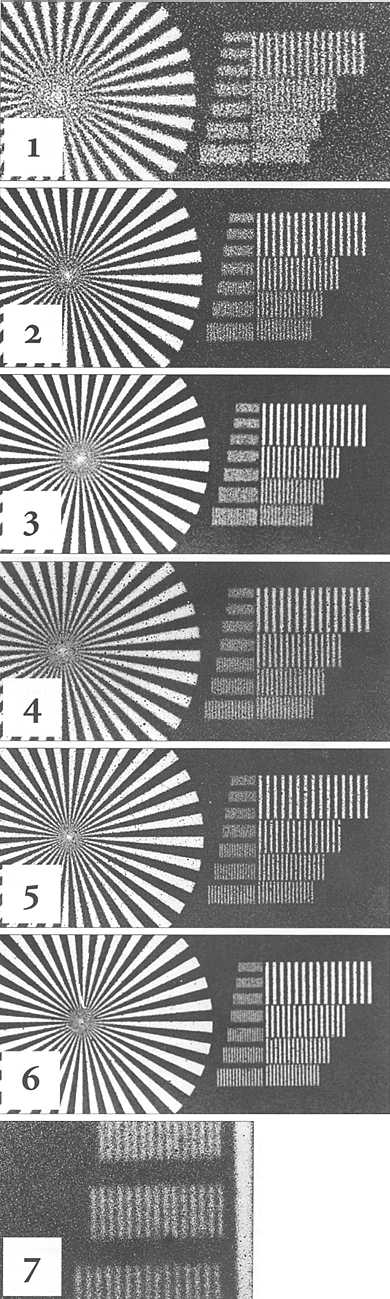
Here is the image I used. I downloaded their JPEG image and used Photoshop to crop out a square 179×179 pixels from subimage 4, the scan from a 35mm TMax 100 image. As you see, this subset of the original image includes all the bar patterns in the resolution chart, while leaving out the starburst pattern.
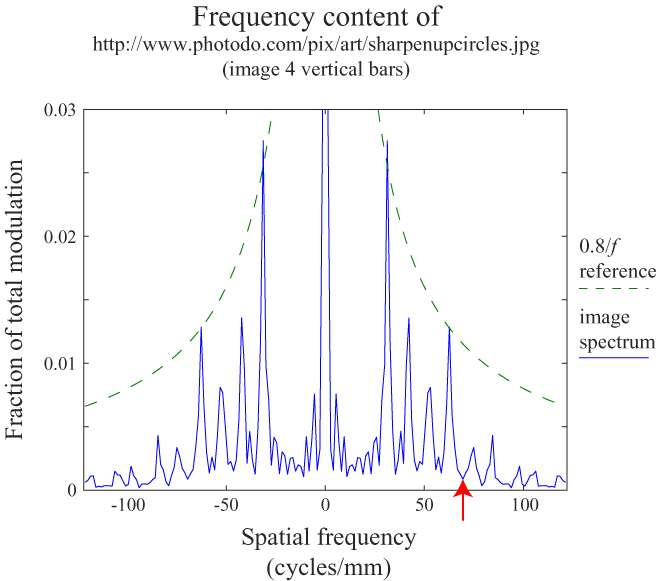
In MATLAB, I linearized the image by dividing by 255 and raising each value to the power 2.2. I then took the 2D Fast Fourier Transform of the result and plotted the spatial frequencies along the X axis; the result is shown below. I normalized the vertical axis by dividing by 1792, the maximum magnitude possible for an FFT of this size, then scaling by 1/(1-0.09), since it seemed to me that the contrast of the original image was limited by a black level of about 0.09. I then exported an EPS file and rescaled and tidied up in Adobe Illustrator.
![]() This is an SVG document. If you see a blank space above, you might
need to install a browser plugin to display it. See Adobe's Web
site to download the correct plugin.
This is an SVG document. If you see a blank space above, you might
need to install a browser plugin to display it. See Adobe's Web
site to download the correct plugin.
Unfortunately, Microsoft changed their plugin interface in Internet Explorer 6, and Adobe hasn't rewritten their SVG plugin yet. Use Explorer 5 or earlier, Netscape, Mozilla, Firefox, or Opera.
If you have no success at all, view the rasterized PNG version.
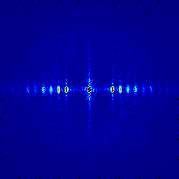
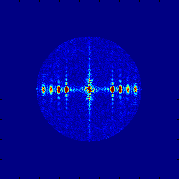
This graph shows that there is, in principle, information captured on the negative to more than 100 cycles/mm, but it doesn't show how that affects image detail. I did some very crude filtering in the frequency domain to see how the image changes with loss of high-frequency detail. This consisted of just zeroing all the coefficients for frequencies past a radius of 52 in the FFT (shown by the red arrow on the 2D plot above), which corresponds to a spatial frequency of about 70 cycles/mm. Here is a display of the magnitude spectrum for this image, before and after filtering.
And now, the raw image and the filtered image:
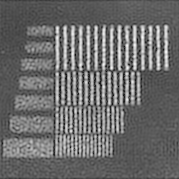
As you can see, the bars on the left are no longer resolved: their fundamental frequency is beyond the cutoff. But the bars on the right, ranging up to about 62 cycles/mm, don't look much different to my eye.
This page can't possibly tell the whole story, because