Anyway, a first-order approximation to the nonlinearity of a CRT
is
L = ν γ
where
L is the radiance (light
intensity) from the monitor, ν is the voltage applied to the CRT gun
(normally proportional to the digital value in the frame buffer), and
γ (Greek letter “gamma”) is a
constant particular to the monitor; it's the unknown parameter that
makes it all work. It usually ranges from about 2.0 to about 2.5. One
useful fact is that the gamma curve is linear in log-log space
(i.e. logL as a function of logν), and γ is just the slope of
that line.
The direct way to measure gamma is with a photometer: a device to measure light intensity on a linear scale. The basic procedure is to set up the monitor as it will be used (brightness, contrast, etc.) and to display an area of a specified digital value. By varying the digital value, we can fit the resulting transfer function in log-log space, and come up with a value for gamma.
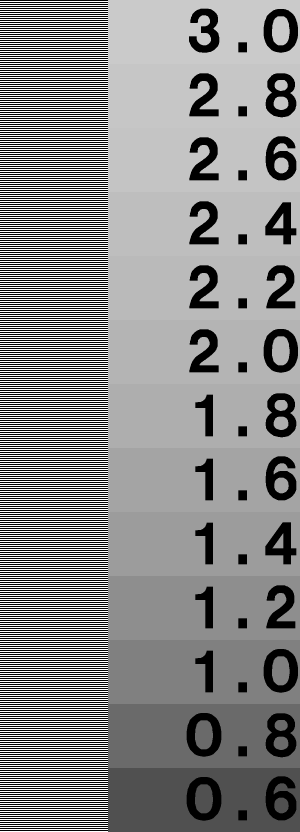
The first obstacle to this procedure is that you may not own a photometer. Fortunately, gamma can be found visually to some accuracy by displaying a particular type of image. Here's a lovely example from Greg Ward Larson: it's part of the Radiance software distribution. See this page for Greg's explanation of gamma correction. The idea is this: there's a pattern down the left that is half black (0) and half white (255) in alternating stripes. These should average together to give an overall luminance of 50% of maximum. On the right is a series of labeled patches; these are 50% gray with various gamma corrections applied. Just find the patch that seems to match the brightness of the left strip, and read the gamma of your monitor from there.

Actually, there are a few potential problems you need to know about. First, your monitor may be adjusted wrong. If the black level is set too low, there will be a bunch of digital values for which the monitor will display black. This constitutes a nonlinearity that is guaranteed to mess up the test above; likewise if the black level is set too high. The black level is generally controlled by the "brightness" knob on your monitor. Here's an image to help you adjust black level.

Turn the contrast on your monitor up all the way (or to a comfortable viewing level). Adjust the brightness until you can barely make out the letter in the image. Ideally, the black raster of your monitor will now be just on the edge of visibility compared to the area just outside it.
One common mistake that people make in designing a gamma test pattern is using vertical stripes, or a checkerboard pattern at maximum pixel frequency. The following image should show a constant brightness, but half is darker on my CRT display. On a good LCD (Apple 20″ Cinema Display), they look much more similar, but still not identical.

The problem is that most display devices have different characteristics in the vertical and horizontal directions: their resolution isn't actually isotropic, and this interacts with the nonlinearity to give a bogus result.
Another "gotcha" in gamma correction is its interaction with
quantization. Images are almost always stored as arrays of integers,
usually 8-bit integers. Storing an image this way without gamma
correction is likely to cause problems, because the eye is more
sensitive to luminance variations at the dark end of the luminance
scale. Put another way, you need smaller quantization steps at the low
end. See the banding in the following image?

The way to minimize this problem is to gamma correct the pixels in
a higher resolution (floating point or, say, 16 bit integers),
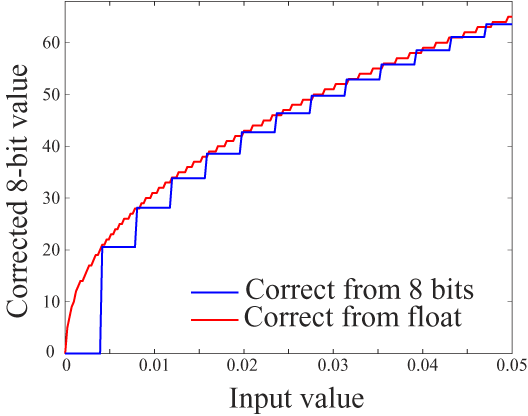
then quantize. Here is a plot showing the effect at low intensities:

You can see how quantizing from linear 8-bit values (e.g. from a file)
skips levels in the output; there are no output values less than
20!
But, you ask, what happens to bright values? There are two answers to this question:
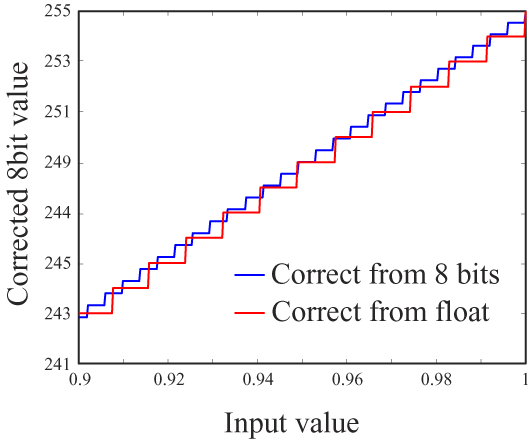
Let's look at another part of the same graph, this time for the brightest values.

You can see that the quantization step has only about doubled from the case of linearizing from the 8-bit values. But there's a more important factor: Weber's Law. This states, most fundamentally, that discrimination is nonlinear: we are more sensitive to small changes when the stimulus magnitude is small. In this case, it means we can distinguish finer brightness variations in dark areas of an image. So we actually need finer quantization for small pixel values, which is what the red line shows in the graph above.
See how much better the image below looks? I created it by starting
with floating-point pixel values, correcting for gamma first, then
quantizing to 8 bits. The transfer curve is essentially the red line
in the graphs above.

The images above were created in MATLAB: the original was a ramp from 10 to 20 across a 1024x1024 image. I used the floor() function to quantize the first image to integer values, then gamma corrected using the formula im_quant = (floor(im)/255).^0.45*255;
For the second image, I corrected without quantization: im_gamma = (im/255).^0.45*255;
I then converted to 8-bit unsigned integers and wrote a TIFF file of each. I then used Photoshop to add black borders; a bright surround tends to mask quantization artifacts in dark images.
